You are using an out of date browser. It may not display this or other websites correctly.
You should upgrade or use an alternative browser.
You should upgrade or use an alternative browser.
multi time frame Support and resistance like no other
- Thread starter blkmethod
- Start date
austin pope
New Member
- Credits
- 0
Hi need a trial version thanks in advance
It's only a few posts up...Hi need a trial version thanks in advance
austin pope
New Member
- Credits
- 0
Hi thanks that true but
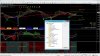
OB_MTF expired! Please re-new your licence
OB_MTF expired! Please re-new your licence
indicator is not crap but this person is crap.. his intention is selling indicator.. and if you want sell then sell like seller dont play with traders .. trail trail trail...enjoy!!!!
this is not support and resistance.. its order block.. stop playing
not the same, that version is crap. n yes order blocks.guys try this ..
Good indicator. Use in real trading, but with the addition of others + EA SemiAutomatic
For good and add indicator. In conjunction should work well .
Forex TSI MACD indicator is an oscillator obtained as a result of a combination of MACD and TSI indicators.
If all traders are familiar with the MACD indicator, not everyone knows about the TSI indicator.
The TSI (True Strength Index) indicator is an index of true strength, which is calculated as the value of the momentum of the price doubled by the exponential method.
The principle of operation of the TSI MACD indicator is that the initial calculation does not come from the momentum of the price as in TSI, but from the MACD values (calculated as the difference between the MACD value on the last bar and the MACD value on the previous one).
FORI TSI MACD INDICATOR SIGNALS
Intersection of indicator lines
The TSI MACD line (blue color on the chart) crosses the signal line (red color) from the bottom up - the entrance to the purchase.
The TSI MACD line crosses the signal line from top to bottom - entry into sales.
Intersection of overbought and oversold zones
If the price is above the level of +70, the currency pair may be overbought, we should expect a price drop and when the TSI MACD line crosses the level of +70 from top to bottom, it is a sell signal.
If the price is below the level of -70, the pair may be oversold, we should expect a growth of the currency pair and when the TSI MACD line crosses the level of -70 from the bottom up, a buy signal.
The use of divergence
Like any other oscillator, the TSI MACD indicator allows you to track all types of divergences.
and if by deviation, then you can add the CCI Trix Divergence TT indicator (levels -250, -200, 200, 250)
Attachments
I am ready to learn but plz don't sell things if u can make money from broker then help traders, also to make money from brokerhemmy u can learn alot from me, dont disrespect me please.
.. I downloaded your all file and I found that all expired ... You open thread that means you want to help traders but this way you can't help like expired indicator , or give to test few week.. that not good. Indicator is your you can do what you want, I am not big trader but I would like to suggest you help traders ....