You are using an out of date browser. It may not display this or other websites correctly.
You should upgrade or use an alternative browser.
You should upgrade or use an alternative browser.
Future Wave
- Thread starter Earl2Rub
- Start date
- Credits
- 29
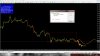
It appears your screenshot is from Tradingview not MT4, so chances are this indicator doesn't exist on MT4 platform.Please share the Indicator that I've showed in the red square. It's like a future wave indicator or something.
Thank you in advance.
It appears your screenshot is from Tradingview not MT4, so chances are this indicator doesn't exist on MT4 platform.
 Could be. I'll check.
- Credits
- 29
I'm 100% sure it's Tradingview
Future FX - indicator
The principle of operation of the indicator is to take the current movement with a size specified by the user and search for a coincidence in the history segment by the main parameters, such as the extremes of candles and their open, close and volatility prices. Found similar historical segments are considered for coincidence, the parameter is returned as a correlation. If they pass through the configured user confidence filter, then the segment of the historical development of the situation, the length of which is also specified by the user, is displayed on the chart as a projection into the future. The look_back parameter allows you to determine the length of a similar segment of matching quotes on historical data. The number of timeframes forecasted in the future is set by the look_forward parameter, but it cannot be less than 10% of the coinciding sample and go beyond 30%. Simply put, it is the size of the block of quotes in the historical past, immediately following the coincident one. The meaning is clear that the max_history parameter defines the area of search for matches. It is advisable to use a size of about 2000 and higher (but not more than 10,000), guided by considerations of closeness to calendar coincidences (quarter, half year, year, etc.). The choice of which parameters to compare by is in the Correlation Data line, where OHLC is the abbreviation of the main price parameters of the timeframe, instead of it you can search for averaged values by substituting the letter M, symbolic by substituting the letter T (Typical) or directional ones, substituting W (Weighted) ... The simplest and most understandable way is the most effective. Therefore, we use the default value, when the main OHLC price parameters are added, summed up and averaged, then a search for a match on the history with this type of the given price series is performed. The percentage of correlation, which determines the criterion for the coincidence of the current and historical values of the cor threshold, is also set by the user and cannot be lower than 70%, by default it is 75%.
Indicator information panel
The indicator readings, in addition to the two models projected into the future, are displayed in the upper left corner of the chart as an information window. It contains data on the time and date of the opening of the current timeframe, the size of the analyzed history segment, along with the display of the total number of available time intervals.
Correlations performed - shows how many comparisons were performed in search of a match in a given area and the size of the compared segment of current quotes.
The Correlation line displays the number of similar blocks found above the threshold (user defined 75%) and the average percentage of their correlation, while the best percentage of matches and the date where this site is located in history is displayed below.
The range of the forecasted price movement up (long) and down (short) from the current levels is indicated in the potential line of the same name.
The final assessment of the reliability of the constructed model as a whole is indicated in the final lowest line.
P.S another indicator based on history / maybe someone will come in handy. With respect.