You are using an out of date browser. It may not display this or other websites correctly.
You should upgrade or use an alternative browser.
You should upgrade or use an alternative browser.
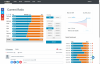
Currency activity indicator
- Thread starter Dexterous
- Start date
[QUOTE = "Dexterous, post: 223139, участник: 19385"] У каждого есть этот индикатор. Доля Pls [/ QUOTE]
http://www.forexcrunchers.com/
https://www.myfxbook.com/community/outlook
https://fxssi.com/tools/current-ratio?filter=EURUSD
http://www.forexcrunchers.com/
https://www.myfxbook.com/community/outlook
https://fxssi.com/tools/current-ratio?filter=EURUSD
Attachments
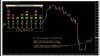
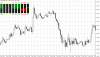
Speed Candles - rate of change of prices on all timeframes
The Speed Candles indicator is displayed on the chart in the form of a histogram and shows the speed and direction of price movements on all timeframes. It will be useful for traders who use in their trading strategies indicators of rate of change in prices, such as CCI (Commodity Channel Index - "commodity channel index"). The direction of price movement with an uptrend is displayed in green, the downtrend is red. Rate of price change is calculated in percent.
The indicator primarily determines the strength of the trend and only then on the possible direction of the trend. It is logical to assume that if the trend direction is the same at several timeframes, as in the figure in the H1-D1 bands, then this will be a sufficiently strong signal for opening a deal. But like all oscillators Speed Candles requires additional confirmation by other indicators of technical analysis.
Attachments
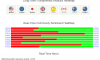
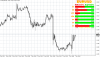
Strength Candles - balance of forces of buyers (bulls) and sellers (bears)
The indicator displays in the price chart information in percent of the current balance of bull / bear forces. Strength Candles is built on tick volume information and previous price changes. The data of other indicators, such as RSI and others, are not used, therefore, according to the author, the information is provided without delay.
As with other indicators Forex showing the ratio of forces of bulls / bears to trust information Strength Candles need to be careful because the data of the tick volume does not reflect the overall situation on the Forex market. It can only be used as an element of a general trend strategy.
Attachments
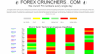
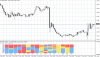
Multi Indicator Watcher
The indicator shows information simultaneously on 16 standard indicators in 9 timeframes and perfectly shows the presence and direction of the trend. The color of the elements of the indicator varies from green to red, which allows the trader at a glance to assess the market situation. The colors of the Multi Indicator Watcher items mean the following:
blue - there is a strong uptrend on the corresponding time frame
blue is an upward trend, but the strength of the trend is small or it ends
yellow - no trend ie. lateral movement of the market (flat)
orange - the beginning or the end of a downward trend
red - a strong downtrend
The indicator operates in two modes:
"Multi-Indic" - displays the values of standard indicators for different timeframes. Pimmer indicator in the picture - the columns show the direction of the trend according to the indicator, and the lines are defined by a time frame.
As you can see, the indicator is well combined with trend trading strategies based on data from several timeframes, such as "Three Elder Screens". Now there is no need to switch between timeframes, just look at the indicator.
The columns specify the currency pair, the timeframe string. Which indicator will be displayed, the list of timeframes and currency pairs is set in the parameters of the indicator Multi Indicator Watcher.
Attachments
Thankyou for sharing great indicatorStrength Candles - balance of forces of buyers (bulls) and sellers (bears)
The indicator displays in the price chart information in percent of the current balance of bull / bear forces. Strength Candles is built on tick volume information and previous price changes. The data of other indicators, such as RSI and others, are not used, therefore, according to the author, the information is provided without delay.
As with other indicators Forex showing the ratio of forces of bulls / bears to trust information Strength Candles need to be careful because the data of the tick volume does not reflect the overall situation on the Forex market. It can only be used as an element of a general trend strategy.
I want to trying use this indicator on my chart firewoodfx
- Credits
- 0
Thanks for sharingMulti Indicator Watcher
The indicator shows information simultaneously on 16 standard indicators in 9 timeframes and perfectly shows the presence and direction of the trend. The color of the elements of the indicator varies from green to red, which allows the trader at a glance to assess the market situation. The colors of the Multi Indicator Watcher items mean the following:
blue - there is a strong uptrend on the corresponding time frame
blue is an upward trend, but the strength of the trend is small or it ends
yellow - no trend ie. lateral movement of the market (flat)
orange - the beginning or the end of a downward trend
red - a strong downtrend
The indicator operates in two modes:
"Multi-Indic" - displays the values of standard indicators for different timeframes. Pimmer indicator in the picture - the columns show the direction of the trend according to the indicator, and the lines are defined by a time frame.
As you can see, the indicator is well combined with trend trading strategies based on data from several timeframes, such as "Three Elder Screens". Now there is no need to switch between timeframes, just look at the indicator.
The columns specify the currency pair, the timeframe string. Which indicator will be displayed, the list of timeframes and currency pairs is set in the parameters of the indicator Multi Indicator Watcher.