- Credits
- 0
I have a 100% profitable strategy, I have more than 50 consecutive operations won, I need help to create an indicator of the strategy since it is very tiring waiting on the computer all day waiting for the signal to buy or sell! Please, someone who can make an indicator of the strategy so that the signal appears on the screen, send the signal to the email and the cell phone! Please someone who can help me with the creation of the indicator would be very grateful, so we could both benefit from the indicator and share it in this forum, it would be a great success! I share the free strategy, I cost 500 dollars! but believe me is very good and effective!
Strategy:
Main rule: Always operate in favor of the trend.
Temporality: 1 hour, 15 minutes, 5 minutes.
RSI indicator of 14 periods 70 and 30 levels.
ADX indicator: 12, 26 and 9 are well stretched
Rules for purchase:
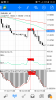
1) See in 1 hour that there is an uptrend, action of the price that exists higher highs and lower highs.
2) That the price is well stretched upwards in the ADX in a 1 hour period. (This is to ensure that there is an uptrend)
3) In time of 5 minutes or 15 minutes the purchase entry is made, the RSI indicator must be at level 30 of over sales.
Rules of Sale:
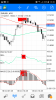
1) See in 1 hour that there is a bearish trend, price action that exists lower lower and higher lower.
2) That the price is well stretched descendingly in the ADX in temporality of 1 hour (This to ensure that there is a bearish trend).
3) In time of 5 minutes or 15 minutes the sale entry is made the RSI indicator must be at level 70 of over purchase.
Take profit of 20 pips
Stop loss of 15 pips
Several are going to ask that if it works with the 7 period rsi, if it works but it gives a lot of losing entries, I have tried both ways and the 14 period one works much better for me. It is a very simple strategy, but very easy, you can make more than 100 pips a day.
The logic of the strategy is that when there is a trend the price always takes a break so it goes backwards to continue with the momentum of the trend. and also works in range, only that in range you have to go for a few pips because the price turns very fast since they are small impulses.
I do not understand any programming but I know there are good programmers in this place, thanks in advance for any beneficial contribution or help they can provide! strategy is not the holy grail because if I had lost but the gains have been much more than lost, but it would be good that together we can provide suggestions to filter the signals and make better entries! This strategy is not mine, I shared it when I enter a course that I bought forex I cost 500 dollars, and I am sharing them completely free, so approvechenla, is very good believe me, you can make more than 100 pips a day, in the group had some who were winning a lot but a lot, more than a hundred dollars a day with this strategy, I'm still on trial, but I've tried a lot of strategies and the one that has worked best for me is this, please, someone who can help! Sorry for my English, I do not handle the language well! Thank you very much for any help you can give me!
This is a simple but very effective strategy, try it on demo and you will realize how good it is the only bad thing is the time you have to spend waiting for the signal, please someone who can help with the creation of the indicator that signal when comply with the conditions of entry and send the signal to the meta trader platform, cell phone and email.
Strategy:
Main rule: Always operate in favor of the trend.
Temporality: 1 hour, 15 minutes, 5 minutes.
RSI indicator of 14 periods 70 and 30 levels.
ADX indicator: 12, 26 and 9 are well stretched
Rules for purchase:
1) See in 1 hour that there is an uptrend, action of the price that exists higher highs and lower highs.
2) That the price is well stretched upwards in the ADX in a 1 hour period. (This is to ensure that there is an uptrend)
3) In time of 5 minutes or 15 minutes the purchase entry is made, the RSI indicator must be at level 30 of over sales.
Rules of Sale:
1) See in 1 hour that there is a bearish trend, price action that exists lower lower and higher lower.
2) That the price is well stretched descendingly in the ADX in temporality of 1 hour (This to ensure that there is a bearish trend).
3) In time of 5 minutes or 15 minutes the sale entry is made the RSI indicator must be at level 70 of over purchase.
Take profit of 20 pips
Stop loss of 15 pips
Several are going to ask that if it works with the 7 period rsi, if it works but it gives a lot of losing entries, I have tried both ways and the 14 period one works much better for me. It is a very simple strategy, but very easy, you can make more than 100 pips a day.
The logic of the strategy is that when there is a trend the price always takes a break so it goes backwards to continue with the momentum of the trend. and also works in range, only that in range you have to go for a few pips because the price turns very fast since they are small impulses.
I do not understand any programming but I know there are good programmers in this place, thanks in advance for any beneficial contribution or help they can provide! strategy is not the holy grail because if I had lost but the gains have been much more than lost, but it would be good that together we can provide suggestions to filter the signals and make better entries! This strategy is not mine, I shared it when I enter a course that I bought forex I cost 500 dollars, and I am sharing them completely free, so approvechenla, is very good believe me, you can make more than 100 pips a day, in the group had some who were winning a lot but a lot, more than a hundred dollars a day with this strategy, I'm still on trial, but I've tried a lot of strategies and the one that has worked best for me is this, please, someone who can help! Sorry for my English, I do not handle the language well! Thank you very much for any help you can give me!
This is a simple but very effective strategy, try it on demo and you will realize how good it is the only bad thing is the time you have to spend waiting for the signal, please someone who can help with the creation of the indicator that signal when comply with the conditions of entry and send the signal to the meta trader platform, cell phone and email.