• Welcome back! Thank you for being a part of this Traders Community. Let's discuss and share :)
    Selamat datang kembali! Trimakasih telah menjadi bagian dari Komunitas Trader ini. Mari berdiskusi dan berbagi :)

MA and RSI reverse signal

jooo00000

Member
Credit Hunter
Credits
0
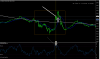
I attach the system that I use to detect trend changes.

MA of 13 periods within RSI 10.

RSI above 70 and MA crosses rsi is Sell.

RSI below 30 and MA crosses rsi is buy.

MA critical level at level 10 or 90 with Rsi at level 70 or 30, indicates change.

I share this strategy to improve it among all.Reverse Signal1.jpg Reverse Sugnal 2.jpg
 

Attachments

  • Reverse Signal1.jpg
    Reverse Signal1.jpg
    309.6 KB · Views: 1,218
  • Reverse Sugnal 2.jpg
    Reverse Sugnal 2.jpg
    319.5 KB · Views: 1,185
  • Template.zip
    Template.zip
    709 bytes · Views: 268
Rather RSI or EMA are repainting indicators but in this constellation they do..I get a crossing of the RSI and EMA but when I check it again after few periods the crossing is not there any more..
 
What timeframe that you prefer for this setup?
I think work on different timeframe also will giving different signal
 
Guys, Please look carefully in this setup. RSI is a momentum oscillator which will move between the minimum(0) and maximum(100) values but MA will not work like this so if you put MA in RSI window then MA will start recalculates the position or in easy terms, it will repaint.
 
I have analyzed and tested, the problem of the RSI is that it showed overbooking and overbought. Just that. But, if the market decides to go higher and more ... and more! the RSI can not identify that
 

Attachments

  • fx.png
    fx.png
    37.8 KB · Views: 171
Back
Top